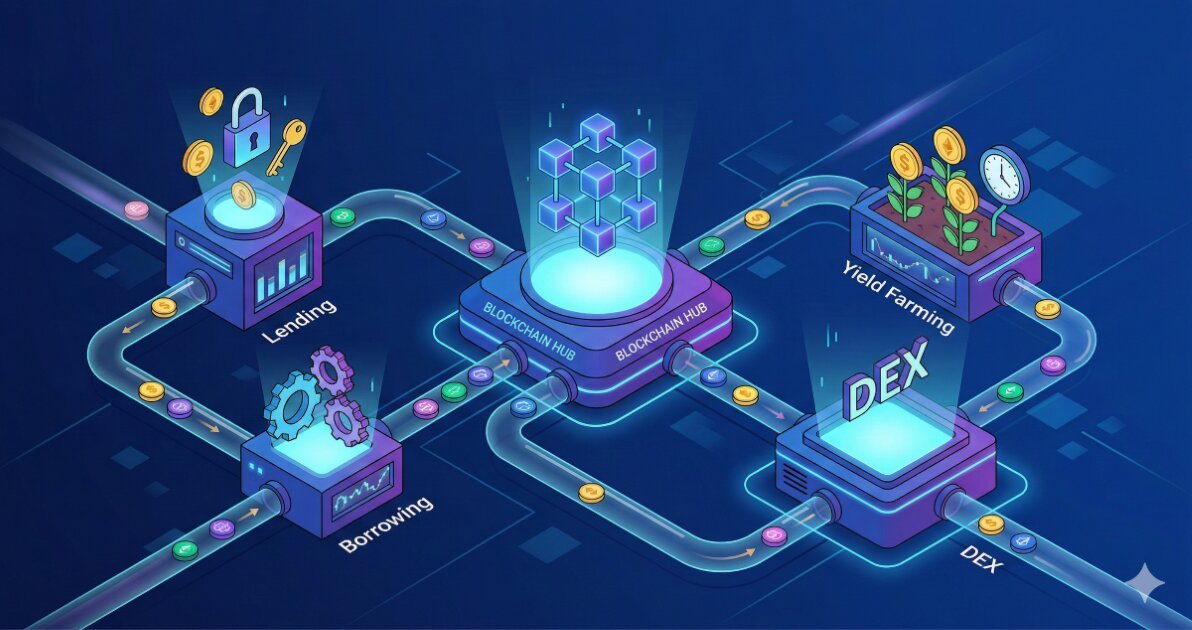
Decentralized exchanges (DEXs) replace centralized order books and custodians with onchain smart contracts that let users trade tokens directly from their wallets. The design choice between automated market maker (AMM) models, orderbook implementations, and hybrid approaches determines execution quality, capital efficiency, and who bears inventory risk. This article examines the core mechanisms, common failure modes, and operational considerations for practitioners selecting or integrating DEX protocols.
Liquidity Provision Models
AMM pools aggregate capital from liquidity providers (LPs) into reserve pairs governed by a pricing function. The constant product formula (x * y = k) remains the most deployed variant: swapping token A for token B reduces the A reserve and increases the B reserve such that their product stays constant. Price impact grows nonlinearly with trade size relative to pool depth. A 10,000 USDC buy against a 100,000 USDC / 50 ETH pool moves the price roughly 10%, while the same trade against a 1,000,000 USDC pool moves it closer to 1%.
Concentrated liquidity models allow LPs to allocate capital within specific price ranges. Instead of spreading 10,000 USDC across the entire price curve from zero to infinity, an LP can concentrate it between 1,800 and 2,200 USDC per ETH. This multiplies effective liquidity for trades within that range but leaves the LP with zero liquidity contribution outside it. Ranges must be actively managed as price moves; positions that drift fully out of range earn no fees and suffer impermanent loss without offsetting income.
Orderbook DEXs store limit orders onchain or use offchain relayers with onchain settlement. Fully onchain orderbooks face gas cost constraints: placing, canceling, and matching orders each consume block space. Throughput limits on most chains make continuous orderbook updates expensive during volatile periods. Offchain orderbook models reduce gas use by collecting signed orders offchain and submitting only matched trades for settlement, but introduce relayer trust assumptions and potential front running by the relayer operator.
Price Discovery and Arbitrage Dynamics
DEX prices lag or lead centralized exchange (CEX) prices depending on where informed flow concentrates. Arbitrageurs watch for discrepancies: if ETH trades at 2,000 USDC on a CEX and 2,010 on a DEX pool, they buy on the CEX, sell on the DEX, and pocket the spread minus gas and slippage. This activity pushes the DEX price back toward the CEX reference.
The arbitrage feedback loop depends on gas costs, block time, and MEV (maximal extractable value) extraction. On Ethereum mainnet, a 0.5% price gap might not cover gas and priority fees during congestion. On low fee chains, tighter spreads equilibrate faster. MEV bots monitor the mempool and insert their arbitrage transactions ahead of user trades, effectively taxing retail flow. Flashbots bundles and private relays reduce mempool exposure but shift value capture from public miners to sophisticated searchers.
Stablecoin pairs and correlated asset pools use alternative curves designed for minimal slippage near 1:1 ratios. The StableSwap invariant (a hybrid of constant sum and constant product) keeps prices tight within a narrow band but allows the curve to flatten at extremes, preventing infinite leverage. These pools work well when pegs hold but can experience bank run dynamics if one asset depegs: LPs race to exit, liquidity drains, and slippage spikes.
Gas Costs and Execution Routing
Every DEX interaction consumes gas. A simple AMM swap on Ethereum might cost 100,000 to 150,000 gas units. Routing through an aggregator that splits the trade across three pools adds overhead for each additional hop. At 30 gwei base fee and 2,000 USD per ETH, a 150,000 gas swap costs roughly 9 USD. Small trades pay gas as a large percentage of notional; a 100 USD swap pays 9% in fees before counting the LP fee (typically 0.05% to 1.00% of trade size).
Aggregators query multiple DEXs, calculate expected output after fees and slippage, and route orders to maximize proceeds. A 10 ETH sell might split 6 ETH to Pool A and 4 ETH to Pool B if that combination yields more USDC than sending all 10 to either pool alone. The optimizer must account for gas cost per hop: splitting across five pools improves price but may cost more in gas than the price improvement saves.
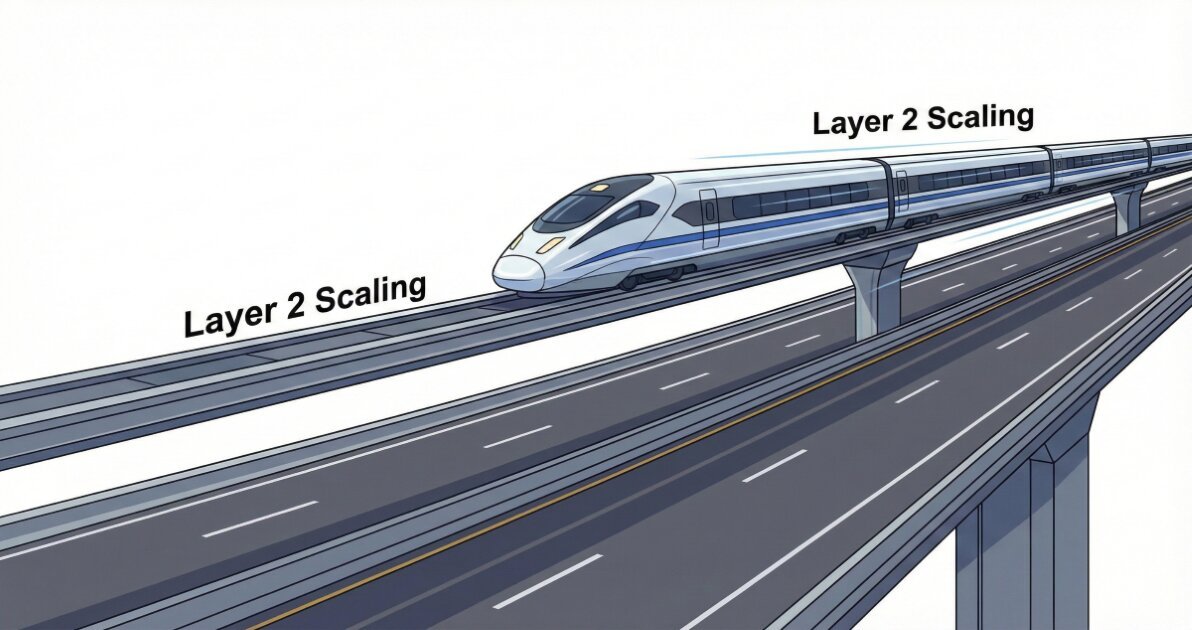
Layer 2 rollups and alternative L1 chains reduce gas costs by one to three orders of magnitude. The same swap costing 9 USD on Ethereum mainnet might cost 0.10 USD on Arbitrum or Optimism. Lower fees enable smaller trades and tighter arbitrage, but fragment liquidity across chains. Crosschain bridges introduce additional trust assumptions, lock periods, and slippage.
Impermanent Loss Mechanics
LPs earn fees but face impermanent loss when the price ratio of their deposited assets changes. If you deposit 1 ETH and 2,000 USDC into a 50/50 pool, and ETH rises to 3,000 USDC, the AMM rebalances your position to roughly 0.816 ETH and 2,449 USDC (maintaining x * y = k). Your total value is 4,898 USDC. Holding the original 1 ETH and 2,000 USDC outright would be worth 5,000 USDC. The 102 USDC difference is impermanent loss, realized when you withdraw. Fees collected during the holding period may offset this, but volatile pairs often generate loss exceeding fee income.
Concentrated liquidity amplifies this dynamic. A narrow range position suffers the same impermanent loss as a full range position when price moves through it, but earns fees only while price stays in range. If price exits the range and never returns, the LP realizes full impermanent loss with reduced fee capture.
Worked Example: Multi-Hop Swap Execution
You want to swap 5,000 USDC for TOKEN on Ethereum. The direct USDC/TOKEN pool has 200,000 USDC and 100,000 TOKEN (implying a 2:1 price). A swap of 5,000 USDC into this pool would receive approximately 2,439 TOKEN after the 0.3% fee, suffering ~2.5% price impact.
An aggregator identifies an alternative route: USDC to ETH in a deep pool (minimal slippage), then ETH to TOKEN in a smaller pool. The USDC/ETH pool is large enough that 5,000 USDC moves the price negligibly. The ETH/TOKEN pool is smaller but has better depth than the direct pair. The two hop route yields 2,470 TOKEN after fees and gas, a 31 token improvement (1.3%) over the direct route. Gas cost for the extra hop is 50,000 units (~3 USD at prevailing rates), which the trade size absorbs comfortably.
If gas were 200 gwei instead of 30, the extra hop would cost ~20 USD, eliminating the benefit. The aggregator would revert to the direct route.
Common Mistakes and Misconfigurations
- Ignoring slippage tolerance in volatile conditions. Setting 0.5% slippage on a thinly traded pair during high volatility guarantees transaction reversion. The price moves between signature and inclusion.
- Providing liquidity to uncorrelated pairs without accounting for impermanent loss. USDC/ETH LPs frequently underestimate how much ETH price movement erodes position value relative to holding.
- Approving unlimited token spend to unaudited contracts. Malicious or buggy contracts can drain wallets. Limit approvals to the amount needed for immediate transactions.
- Routing large trades through low liquidity pools. Splitting a 100 ETH trade across ten pools with 5 ETH depth each results in worse execution than concentrating in the two deepest pools.
- Assuming APY projections are stable. Displayed yields derive from recent fee volume and current TVL. Both fluctuate. A 50% APY calculated from yesterday’s volume may drop to 5% tomorrow.
- Neglecting gas cost in profitability calculations. Arbitrage or LP strategies that work at 10 gwei fail at 100 gwei. Model gas as a variable cost.
What to Verify Before You Rely on This
- Current pool depth and 24 hour volume for the pairs you intend to trade. Liquidity migrates between protocols and chains.
- The smart contract audit status and age. Recent deployments or upgrades may not have been reviewed.
- Fee tier structure for the specific pool. AMMs deploy multiple fee levels (0.05%, 0.3%, 1.0%) for the same pair.
- Oracle dependency for any derivative or synthetic asset pool. Confirm the oracle update frequency and failure mode behavior.
- Governance token emission schedules if evaluating LP incentives. Emissions often decline over time or shift to different pools.
- Slippage and price impact estimates at your intended trade size. Aggregator UIs show estimates but actual execution may differ under mempool congestion.
- MEV protection features. Some frontends route through private relayers; others expose transactions to public mempool.
- Withdrawal lockup or cooldown periods for staked LP tokens in yield farming contracts.
- Bridge security model if moving assets crosschain to access a DEX. Verify whether bridges use multisig, optimistic fraud proofs, or validity proofs.
- Jurisdictional restrictions. Some DEX frontends geoblock users; contracts remain accessible but UI access may require VPN or alternative interface.
Next Steps
- Compare execution quality across aggregators (1inch, Matcha, Paraswap) using identical trade parameters. Record actual received amounts and gas spent.
- Model impermanent loss for a sample LP position over historical price ranges. Use tools like APY.vision or Revert Finance to backtest specific pools.
- Monitor gas prices and set threshold alerts. Execute discretionary trades during low fee periods unless urgency justifies premium costs.
Category: Crypto Exchanges